


NetLogic debugging
Introduction
This module describes some basic procedures to identify, investigate and correct any problems in the NetLogic code using Microsoft Visual Studio or Visual Studio Code locally. For remote debugging see Runtime NetLogic remote debugging
Note
the example screens refer to Visual Studio, set in English.
NetLogic errors are reported at runtime in the Q Studio log panel. In particular, the errors of runtime NetLogics are reported in the tab of the target on which the application is run (for example Emulator Output), the errors of design time NetLogics are reported in the Q Studio Output tab.
To install Visual Studio or Visual Studio Code, or for references on all related debugging features, please refer to the Microsoft website.
Prerequisites
The project must be running for runtime NetLogic debugging. Typically, for debugging purposes the project runs on the Emulator target.
For debugging with Visual Studio Code, the Microsoft C# extension must be installed (available at this link). It is also recommended that the vscode-solution-explorer extension (available at this link) be installed to navigate in the project folder in a similar way to Visual Studio.
Procedure macro
Set the debugging
Click
 : the C# project opens in Visual Studio or Visual Studio Code, depending on the default editor (see Set the predefined code editor).
(Only for runtime NetLogic debugging) In Q Studio click
 to compile and run the Q Application.
Set the debugging:
If using…
Then…
Visual Studio
In the Debug menu click Attach to Process: a window appears showing all the processes running on the machine.
In Attach to click Select, select Managed (v4.6, v4.5, v4.0) and click OK.
In Available Process select the QRuntime.exe process for runtime NetLogic debugging or QStudio.exe for design time NetLogic debugging.
Click Attach: debug mode is started and the bottom bar turns orange.
Insert one or more breakpoints (see Use the breakpoints), to indicate the lines of code where the execution stops to allow the user to check their status, the contents of variables etc.
Visual Studio Code
Open the Run view (CTRL+MAIUSC+D).
In the RUN drop-down menu select Attach to QRuntime for runtime NetLogic debugging or Attach to QStudio for design time NetLogic debugging.
Use the breakpoints
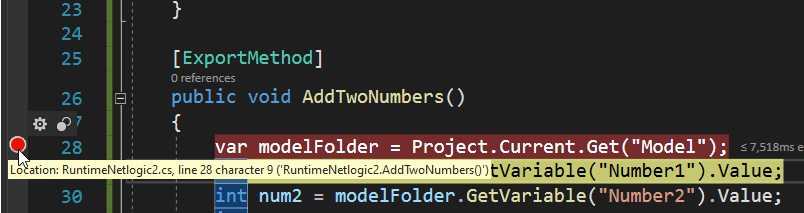
To set a breakpoint, click the column to the left of the row number: an indicator appears.
To remove a breakpoint, click the indicator.
Below is an example of Visual Studio:
Note
breakpoints cannot be set on blank lines
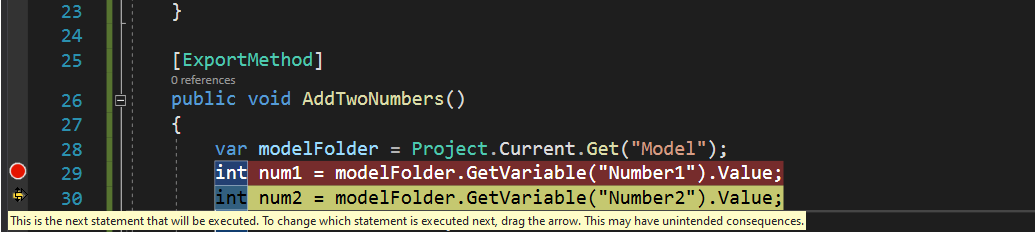
At runtime, the indicator signals when the execution is stopped on the line. Below is a Visual Studio example:
Start the debugging
In Visual Studio or Visual Studio Code in debug mode, open the NetLogic(s) to be checked and, depending on whether it is runtime or design time NetLogic, do as follows:
If the NetLogic is…
Then…
runtime
press F5: the code execution starts, which stops at the first breakpoint.
design time
in Q Studio, right-click the desired NetLogic, then click the method to execute: code execution starts, that stops at the first breakpoint.
In the Locals tab in Visual Studio, or the VARIABLES tab in Visual Studio Code, the local objects and variables of the execution context are listed. For each variable, the current values and their type are reported. In the example, the elements shown in the Locals tab refer to the context of the
AddTwoNumbers()method.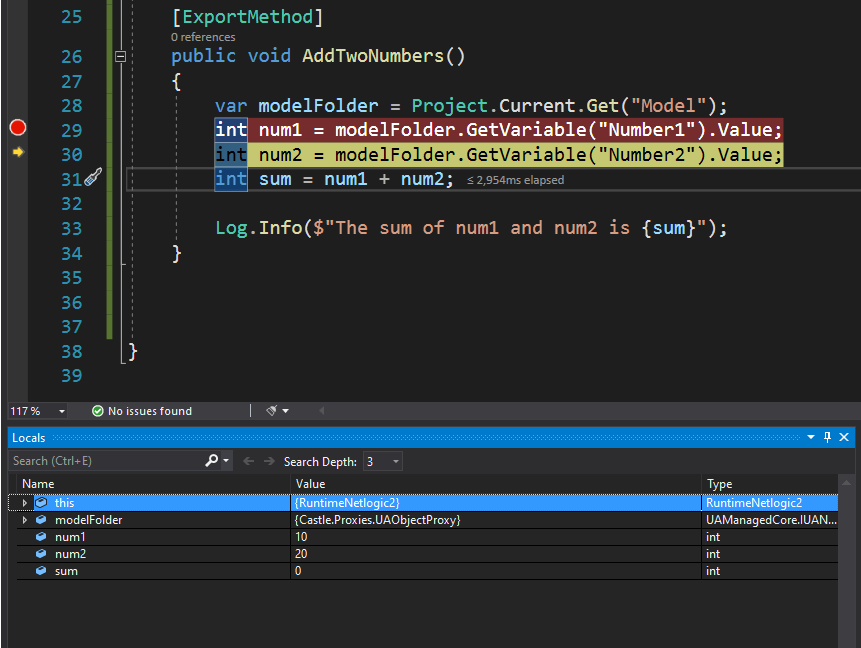
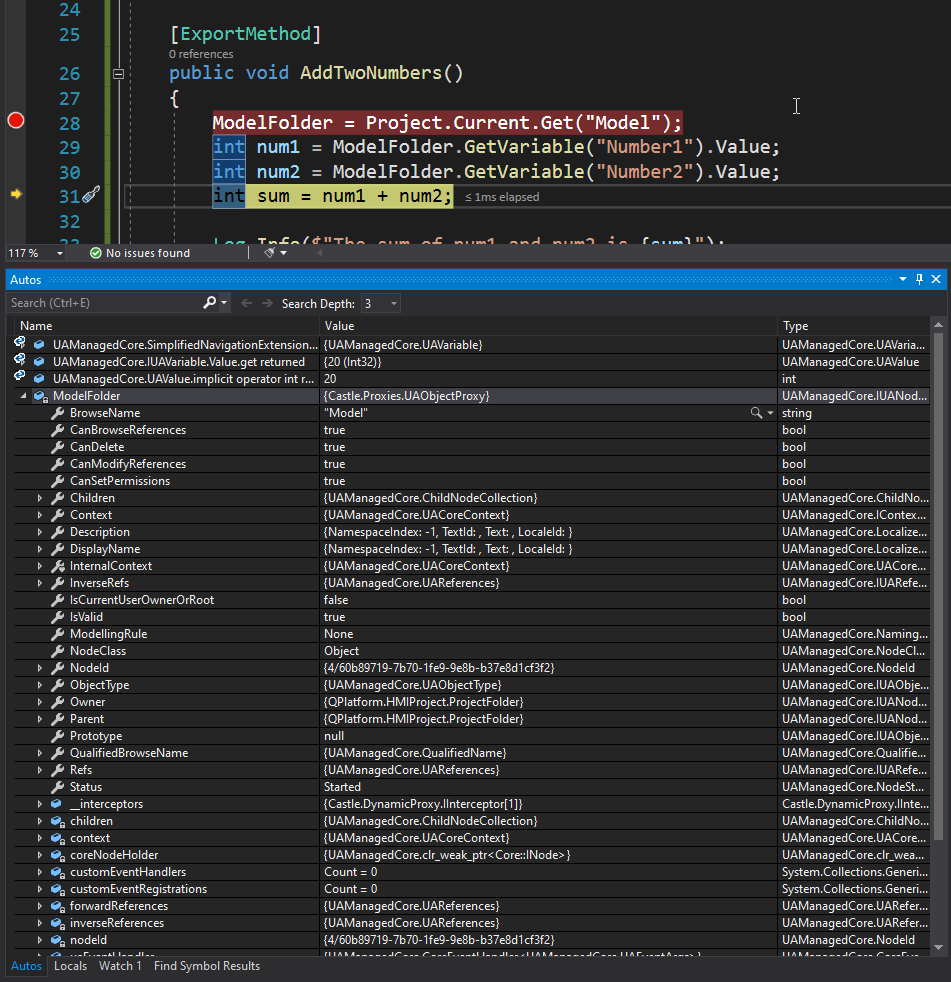
It is possible to expand the elements containing properties to display their values and types of data/objects. Below is an example:
To continue the execution of the code of the next line, press F10.
To continue the execution of the code up to the next breakpoint, press F5.
Repeat steps 3 and 4 until debugging is complete.
Change the code after debugging
Stop debugging:
If the NetLogic(s) is/are…
Then…
runtime
in Q Studio click
 to stop the execution of the project and to stop debugging.
design time
in Visual Studio or Visual Studio Code press MAIUSC+F5 to stop debugging.
Change the code and save the edited .cs files: Q Studio automatically recompiles the .NET solution.
Start debugging after a code change
(Only for runtime NetLogic debugging or if new custom types are created in the project) In Q Studio click
to compile and run the Q Application.Depending on whether you are using Visual Studio or Visual Studio Code, do as follows:
If using…
Then…
Visual Studio
In the Debug menu click Reattach to Process: the process selected in the previous debugging session is automatically selected and debug mode is entered.
Important
if Visual Studio was closed between the previous debugging and the next, it is necessary to click Attach to Process and reset the link (see Set the debugging).
Visual Studio Code
Open the Run view (CTRL+MAIUSC+D).
In the RUN drop-down menu select Attach to QRuntime for runtime NetLogic debugging or Attach to QStudio for design time NetLogic debugging.
Important
if Visual Studio Code ignores the breakpoints in the debugging following the first debugging, restart Visual Studio Code and repeat this procedure.
Open NetLogic to check and, depending on whether it is runtime or design time NetLogic, do as follows:
If the NetLogic is…
Then…
runtime
press F5: the code execution starts, which stops at the first breakpoint.
design time
in Q Studio, right-click the desired NetLogic, then click the method to execute: code execution starts, that stops at the first breakpoint.