


Alarms grid
Introduction
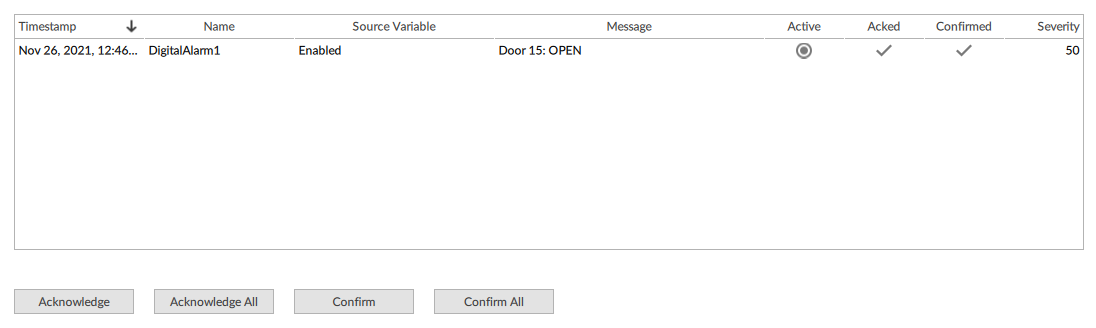
The Alarm grid widget makes it possible to display and manage the alarms at runtime. View the information on alarm events (timestamp, name, source variable, message, severity) and its statuses (active, acknowledged, confirmed) in a table and allow the user to acknowledge and confirm one or all the alarms with dedicated buttons.
Column legend
Column |
Description |
|---|---|
Timestamp |
Date and time of the last update on the alarm event |
Name |
Name of the alarm object that generated the alarm event |
Source variable |
Monitored variable |
Message |
Message associated with the alarm event |
Active |
|
Acknowledged |
|
Confirmed |
|
Severity |
Level of severity of the alarm, on a scale from 1 to 1000 |
Create and customize the Alarms grid
Click
 to open the template library.
From Widgets, drag Alarms grid into the desired node in the UI folder: AlarmGrid1 appears.
To customize the graphical appearance of the Alarms grid widget, see the reference information of the objects that compose it: Data grid and Button.
View alarms shown by a OPC UA server
In Project, right-click the OPC-UA folder, then click New > OPC UA Client.
Configure the Client OPC UA object (see OPC UA client) and set the Events property on Alarms.
View more information on the alarms at runtime
As well as the default information, additional information can be displayed in the widgets. To do this, data in the dedicated column widgets must be added to the Grid objects:
In the Data grid object of the widget, in Column, click
 and select the column type desired, usually Column with text: the column appears at the bottom of the column list.
In the column Text property, click
 and in Alias > {Item}(…) > AlarmCondition select the property of interest for the desired alarm event. To view their properties, expand the various types of alarm events (identified by the
  icon) according to the type from which the alarm of interest derives. Below is the key for the alarm events:
Alarm type
Alarm event label in {Item}
Digital alarm
DiscreteAlarm > OffNormalAlarm
Exclusive limit alarms
In LimitAlarm > ExclusiveLimitAlarm:
ExclusiveDeviationAlarm
ExclusiveLevelAlarm
ExclusiveRateOfChangeAlarm
Non-exclusive limit alarms
In LimitAlarm > NonExclusiveLimitAlarm:
NonExclusiveDeviationAlarm
NonExclusiveLevelAlarm
NonExclusiveRateOfChangeAlarm
Note
for the description of the various alarm types, see Alarm types.
In the column Title property, set a relevant title.
Filter the alarms displayed
By default, the widget displays all the enabled and active alarms. At design time, it is still possible to define filters to display only a part of them. To filter the alarms to display at runtime, set an SQL query that selects the desired alarm events in the Query property of the AlarmsDataGrid object of the widget (for query syntax, see SQL query).
For example, in a system consisting of several machines, to filter the alarms by MachineID, the query to display the alarms relating to the machine with MachineID = 001 could be the following: SELECT * FROM Model WHERE MachineID=0001.
Design a filter on the alarms
By default, the widget displays all the enabled and active alarms. Still, it is possible to filter the alarms displayed at runtime, for example by creating a text box in which the user can enter a query of their choice.
Create a Text box and position it where you like (see Text box).
In the AlarmsDataGrid object of the widget, in the Query property, click
 and set a dynamic link with the Text property of the text box.
Display the events in Alarm Grid in the UTC time zone standard
Click
to open the template library.From Widgets, drag the Alarm Grid object into the desired node in the UI folder: the widget appears in UI.
In the widget Data Grid object, in the Text property of the Timestamp column (or of a column of your choice), click
: the dynamic links window opens.In Alias, click {Item}[…] > AlarmCondition, then click the Time property.
Click Select.
Acknowledge and confirm an active alarm displayed at runtime
Click the desired alarm.
Click the Acknowledge and/or Confirm button: the
 symbol appears in the Acknowledged and/or Confirmed columns.
Acknowledge and/or confirm all active alarms displayed at runtime
Click the Acknowledge all button and/or the Confirm all button: the symbol appears in the Acknowledged and/or Confirmed columns.
See also
Related concepts
Related procedures
Application examples
Configure an alarm associated with the change of temperature
References