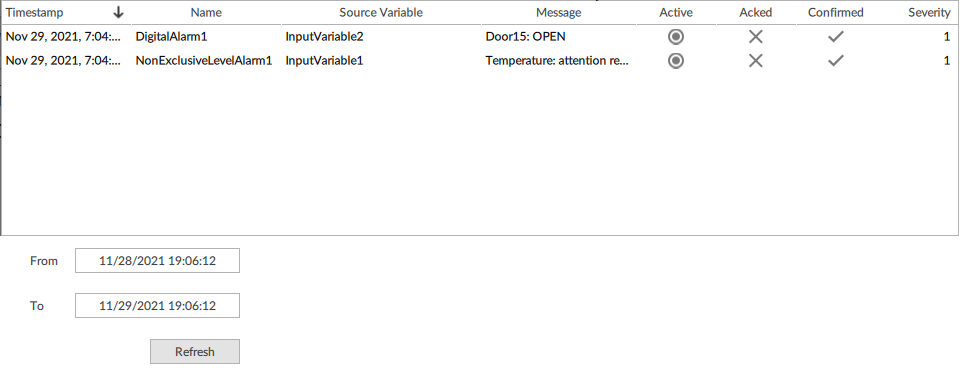
Alarm log grid
Introduction
The Alarm log grid with filter widget displays the logged data in the same way and makes it possible to filter them temporally.
The procedures described in this module refer to the Alarm log grid with filter.

Column legend
Column |
Description |
|---|---|
Timestamp |
Date and time of the last update on the alarm event |
Name |
Name of the alarm object that generated the alarm event |
Source variable |
Monitored variable |
Message |
Message associated with the alarm event |
Active |
|
Acknowledged |
|
Confirmed |
|
Severity |
Level of severity of the alarm, on a scale from 1 to 1000 |
Configure the display of the alarm log
To display the alarm history at runtime, a database, an appropriately configured logger and the Alarm Grid or Alarm History Grid widget is required. To create a database, see Working with databases. To configure logger and widget, do the following:
Click
 , then from Misc drag the Alarm events logger object into the Loggers folder in Project: the new logger appears.
To associate the database with the logger, from Project, drag the desired database object on the value field of the logger Database property.
Click
 , then from Widgets drag the Alarm log grid or Alarm log grid with filter widget into the desired container in Project: the new widget appears.
To view the data recorded at runtime by the logger in the widget, from Project drag the logger onto the value of the AlarmsEventLogger property.
To customize the graphical appearance of the widget, see the reference information of the objects that compose it: Data grid, object, Date and time, and Button.
View more information on the alarms at runtime
As well as the default information, additional information can be displayed in the widgets. To do this, data in the dedicated column widgets must be added to the Grid objects:
In the Data grid object of the widget, in Column, click
 and select the column type desired, usually Column with text: the column appears at the bottom of the column list.
In the column Text property, click
 and in Alias > {Item}(…) > AlarmCondition select the property of interest for the desired alarm event. To view their properties, expand the various types of alarm events (identified by the
  icon) according to the type from which the alarm of interest derives. Below is the key for the alarm events:
Alarm type
Alarm event label in {Item}
Digital alarm
DiscreteAlarm > OffNormalAlarm
Exclusive limit alarms
In LimitAlarm > ExclusiveLimitAlarm:
ExclusiveDeviationAlarm
ExclusiveLevelAlarm
ExclusiveRateOfChangeAlarm
Non-exclusive limit alarms
In LimitAlarm > NonExclusiveLimitAlarm:
NonExclusiveDeviationAlarm
NonExclusiveLevelAlarm
NonExclusiveRateOfChangeAlarm
Note
for the description of the various alarm types, see Alarm types.
In the column Title property, set a relevant title.
Filter the alarms viewed over a period
Set the date and time of start and end of the period of interest in the From and To fields, then press ENTER.
Display the events in Alarm History Grid in the UTC time zone standard
At runtime, the Data Grid object of the Alarm History Grid widget displays the date and time in the Timestamp column in the device local time zone (LocalTime property of the events). It is possible to display the events in the UTC time zone standard (Time property of the events). To do this:
Click
 to open the template library.
From Widgets, drag the Alarm History Grid object into the desired node in the UI folder: the widget appears in UI.
In the widget Data Grid, in the Text property of the Timestamp column (or of a column of your choice), click
 : the dynamic links window opens.
In Alias, click {Item}[…] > PointedNode> LocalTime, then click
 and type Time.
Click Select.
See also
Related concepts
Related procedures
Application examples
Configure an alarm associated with the change of temperature
References
