


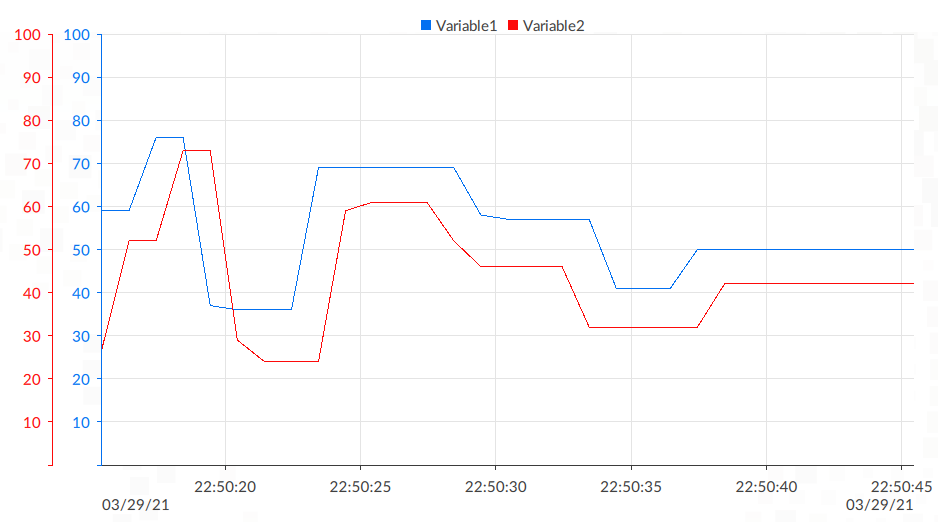
Trend
How It Appears
Applications
Typically used to consult and/or compare the trend of values of variables read in real time and/or logged in a database, for example the temperature trend of an oven.
Configuring the object
Configure the variables to display
To display values in the graphic, the Pens must be configured. In the graphic, each Trend pen draws a trend line with the values of a specific source variable, set via dynamic link, whose values can be read in real time or from a database.
Depending on the variable to display, do as follows:
values in real time of a specific variable |
set the pen source via dynamic link with the variable. |
values in real time of variables sampled by a Data logger |
set the pen source via dynamic link with the Last value property of the variable of interest sampled by the logger. |
values of variables stored in a database |
set the pen source via dynamic link with the column of interest configured in a database. |
Set more Y axes
By default, all displayed pens refer to the default Y axis. When we want to compare the trend of one or more pens on value scales other than the default, we add a specific Y axis to each pen and set the desired value scale on it:
Right-click the desired pen, then point to New > YAxis: the axis appears in the editor and among the properties.
Set the desired full-scale values in Minimum value and Maximum value.
Automatically scale the Y axis
In some graphics, the Y values vary significantly and can make reading difficult. To adjust the scale of the Y axis with respect to the minimum and maximum values in the displayed range, set Automatic scaling to True: at runtime, the Y axis automatically resizes according to the values to display.
Set automatic scrolling on the X time axis
To enable automatic forward scrolling on the X time axis from startup at runtime, set Follow to True.
If Follow is set to False, the graphic displays the time interval defined by Time and Time Window at runtime startup. To display the trend of values outside this range, you have to move manually in the chart. The chart scrolls forward automatically only when the current time is reached.
Set the time zone of the data on the X time axis
To customize the date and time display time zone on the X time axis, set Reference time zone to the desired time zone: UTC, Locale or Session.
To record the data displayed in local time zone, enable the Local Time Log property of Data logger.
Use the object at runtime
If the interactivity of the axes has been activated (Interactive property of the two axes), the actions/interactions described below are possible at runtime.
Action |
How to do it |
|---|---|
Navigation in the graphic |
|
Zoom in/out |
Use pinch-to-zoom or place the mouse pointer in the desired area of interest and scroll forward/backward with the mouse wheel. |
Note
in all these cases, the automatic scrolling on the X axis, if active, stops.
Other actions always available
Action |
How to do it |
|---|---|
View the details of a value |
Click/press near a point of interest of a pen. 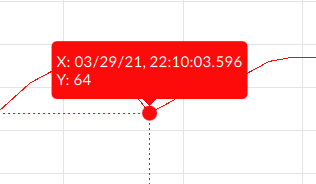
Note the automatic scrolling on the X axis, if active, stops. |
Stop automatic scrolling on the X axis |
Click/press anywhere on the graphic. |
Restart automatic scrolling on the X axis |
Move along the X axis to the current instant. |
Properties
Name |
BrowseName |
DataType |
Description |
|---|---|---|---|
| Model | Model |
Reference to the information model or database from which to obtain the data |
|
| Query | Query |
Standard SQL query to filter the data of interest. It can be used both to filter data from a database and to filter data obtained from a node-based model. In case of a node-based model, the SELECT * FROM Model part is mandatory, followed by the WHERE clause with which to indicate the search conditions - e.g.: SELECT * FROM Model WHERE Speed > 40. |
|
| Refresh time | RefreshTime |
Sampling interval in milliseconds |
|
| Key visible | LegendVisible |
Show/hide the legend of the pens |
|
| Reference time zone | ReferenceTimeZone |
Time zone for displaying the date and time (UTC: time zone standard; Locale: time zone of the device from which the data is generated; Session: session time zone). |
|
| Pens | Pens |
Collection of TrendPen |
Trend lines. Trend pen collection of objects |
XAxis |
|||
YAxis |
|||
| Visible | Visible |
Show/hide the window.
(Inherited from Element)
|
|
| Enabled | Enabled |
Enables/disables the interaction with the user (True = enabled; False = disabled).
(Inherited from Element)
|
|
| Opacity | Opacity |
Opacity level (0 = transparent)
(Inherited from Element)
|
|
| Left margin | LeftMargin |
(Only if Horizontal Alignment = Left or Center or Stretch) Distance between the left edge of the object and the left edge of its container.
(Inherited from Element)
|
|
| Top margin | TopMargin |
(Only if Vertical Alignment = Top or Center or Stretch) Distance between the top edge of the object and the top edge of its container.
(Inherited from Element)
|
|
| Right margin | RightMargin |
(Only if Horizontal Alignment = Right or Center or Stretch) Distance between the right edge of the object and the right edge of its container.
(Inherited from Element)
|
|
| Bottom margin | BottomMargin |
(Only if Vertical Alignment = Bottom or Center or Stretch) Distance between the bottom edge of the object and the bottom edge of its container.
(Inherited from Element)
|
|
| Width | Width |
Width of the window. It can assume values greater than or equal to zero. The Auto value sets the width equal to the width of the content (in this case, in the absence of content the object collapses).
(Inherited from Element)
|
|
| Height | Height |
Height of the window. It can assume values greater than or equal to zero. The Auto value sets the height equal to the height of the content (in this case, in the absence of content the object collapses).
(Inherited from Element)
|
|
| Horizontal alignment | HorizontalAlignment |
Alignment of the object on the horizontal axis. Left = the left side is positioned on the left side of the container, except for the left margin; Right = the right side is positioned on the right side of the container, except for the right margin; Center = the center of the object is positioned in the center of the container, except for the left and/or right margins; Stretch = object width equals container width, except for the left and/or right margins.
(Inherited from Element)
|
|
| Vertical alignment | VerticalAlignment |
Alignment of the object on the vertical axis. Top = the top side is positioned on the top side of the container, except for the top margin; Bottom = the bottom side is positioned on the bottom side of the container, except for the bottom margin; Center = the center of the object is positioned in the center of the container, except for the top and/or bottom margins; Stretch = object height equals container height, except for the top and/or bottom margins.
(Inherited from Element)
|
|
| Rotation | Rotation |
Rotation of the object around its center point. Positive values indicate clockwise arc degrees.
(Inherited from Element)
|